
Bankfull Discharge
Introduction
A channel is a conduit for water that tends to have a geometrical form sized and shaped to carry an amount of water roughly equal to the peak flow that occurs ever year to once every 3 years. Bankfull discharge is the flow that just fills the channel, i.e. fills up to and including the banks. Some common physical indicators of bankfull stage include: breaks in the bank slopes; elevations of depositional features; changes in substrate material; inundation of floodplain swales; etc.
Unfortunately, the concept of bankfull discharge is a gross simplification of the realities of how rivers are sized and shaped in space and time. Many methods for estimating bankfull discharge exist, and each has its assumptions, limitations, and uncertainties. Of importance, the commonly used approach of computing bankfull discharge based on statistical flood frequency analysis is problematic fo rthe LYR, because this method assumes that each year's peak flow is independent and part of a single probabilistic distribution that is "stationary". To be stationary, LYR peaks flows would have to be free of any influence of cyclical climatic patterns, including El Nino / Southern Oscillation, Pacifici Decadal Oscillation, interannual to decadal periods of drought or flood, and any climatic change trend. Many, if not all of these do in fact influence peak flows on the LYR. Further, flows are influenced by the operations of man-made facilities, which not change when dams are built (i.e., 1941 and 1970), but also every time peak flows are influenced by flow regulation. This is especially true during years with low peaks. Thus, although studies reported below provide estimates from statistical peak flow analysis, such estimates are inferior to those made using field indicators in this setting.
Bankfull Discharge Field Indicators
No one has yet performed a systematic evaluation of all field indicators and hydraulic modeling results to comprehensively assess bankfull discharge. The closest to that was an analysis of when various landforms inundate performed by Wyrick and Pasternack (2012) as well as the computation and analysis of depth-discharge relationships by Wyrick et al. (2013).
- According to Wyrick and Pasternack (2012), geometric slope break indicators for some streambanks and the stage at which most swales on the floodplain inundate lead to the perspective that bankfull discharge is as low as ~3,000 cfs. The question is whether one views such swales as in-channel or overbank landforms. because much of the sediment making up the banks is very loose, banks cannot keep a steep slope in many areas, hence the possibility for swales. Also, in places where floods push out of the banks, that pushing creates incipient channels, which take on the form of a swale.
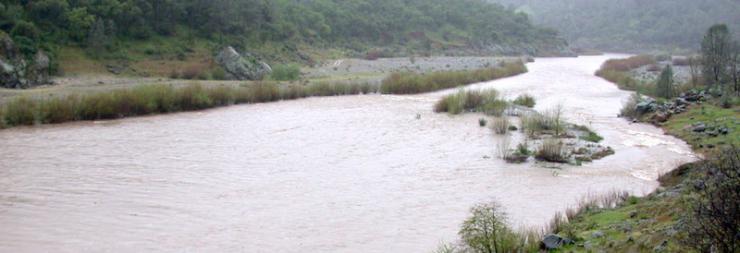
- As shown in the photo below, the medial bar at the apex of Timbuctoo Bend overflows at ~5,000 cfs. In the photo, not only is the island mostly inundated, but the vegetation along the banks is unudated as well, and that vegetation is right or below the slope break for the banks. This level of inundation is a very strong indicator that bankfull discharge is roughly 5,000 cfs. No systematic analysis of the onset of inundation of all medial bars in the river has been performed.
Bankfull Discharge Statistical Estimates
- Moir and Pasternack (2008) analyzed the Smartsville gage data and reported two values for the 1.5-yr return interval statistical bankfull discharge estimate, each using a different time period. For the modern flow regime (1971-2004), they computed a 1.5-yr return interval statistical bankfull discharge estimate of 5620 cfs (159.2 cumecs). This value is not far off from the flow shown in the photo above. Integrating across all years since Englebright Dam was built (1942-2004), they computed a 1.5-yr return interval statistical bankfull discharge estimate of 11,600 cfs (328.5 cumecs). No value was computed for just the period 1942-1970.
- Wyrick and Pasternack (2012) used HEC-SSP to compute the 1.25-yr recurrence interval statistical bankfull discharge for both the Smartville and Marysville gages using the period 1970-2010 for the modern LYR flow regime. They computed values of 4,085 and 5,612 cfs for those gages, respectively.
Bibliography
- Moir, H. J. and Pasternack, G. B. 2008. Relationships between mesoscale morphological units, stream hydraulics and Chinook salmon (Oncorhynchus tshawytscha) spawning habitat on the Lower Yuba River, California. Geomorphology 100:527-548
- Wyrick, J. R. and Pasternack, G. B. 2012. Landforms of the Lower Yuba River. Prepared for the Yuba Accord River Management Team. University of California at Davis, Davis, CA, 91pp.
- Wyrick, J. R., Gonzalez, R. and Pasternack, G. B. 2013. Hydraulic geometry of the lower Yuba River: depth-discharge relationships. Prepared for the Yuba Accord River Management Team. University of California at Davis, Davis, CA, 15pp.